Examples of using RSG software in Graphics, Physics and Mathematics
David Gross
david.gross8@gmail.com
Graphics
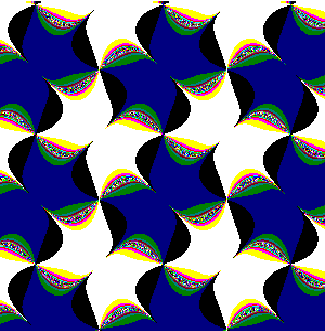
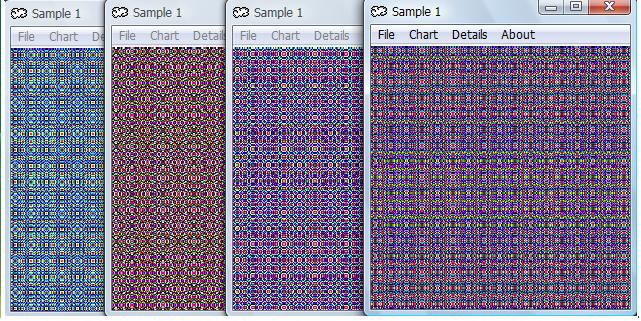
The software can create variety of shapes according to the inserted functions.
The graphics can be used for websites design, textile design and the like.
Examples:

Scientific examples
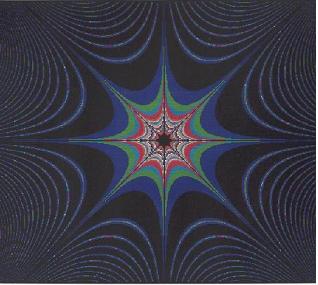
1. Point Charges:
The next graphs present the electric potential of two point charges (one is positive and the second negative). The upper drawing was created by RSG (Realex Space Graphing) and the lower one by Mathematica software.
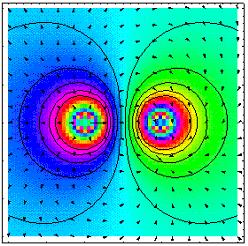
The function is: F(x,y) = 1000 /sqr(x^2+y^2)-1000/sqr((x+200)^2+(y)^2)
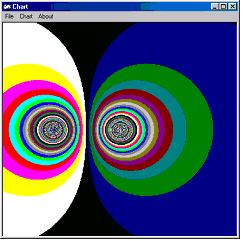
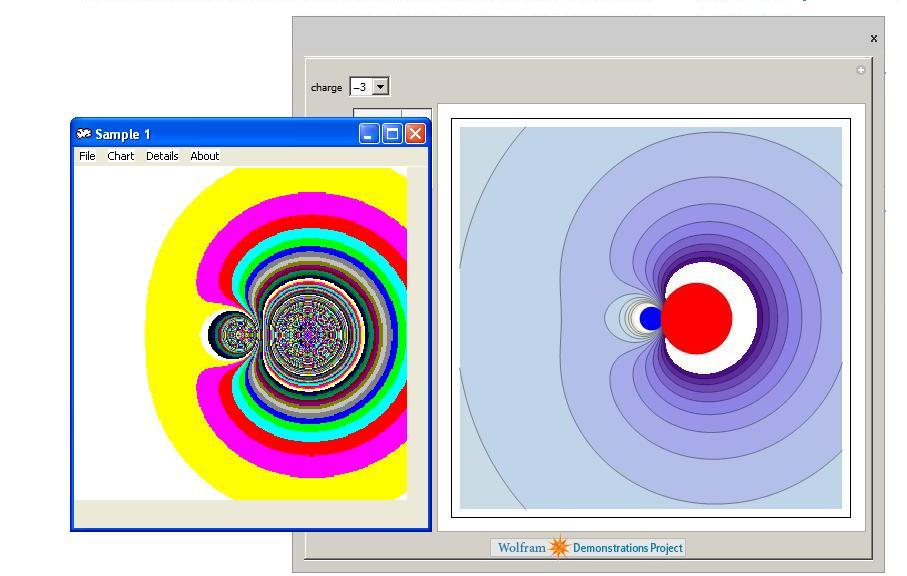
Another example of point charges presented below. The right one created by Mathematica software and the left one by RSG.
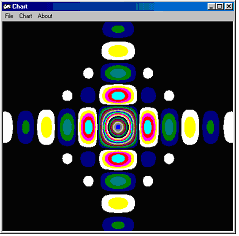
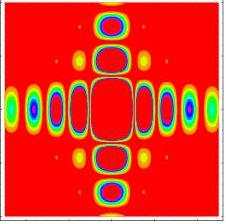
2. Diffraction
The next example shows the light intensity that received on a screen, when a light beam is passing through a rectangular aperture. This phenomenon is called – Diffraction. It shows the advantage of RSG software. At the upper graph (RSG) we can see the difference between the critical points, if it Minima or Maxima. The difference is presented by different colors. At the Minima the colors are yellow-white, and at the Maxima the colors are blue-green. At Mathematica software (lower graph) this distinction is not exist.
3. Mathematics – Critical Points
Here is an example of finding the critical points of the function:
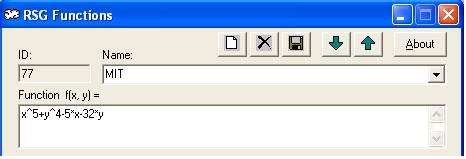
f(x,y)=x^5+y^4-5*x-32*y
by the RSG method.
RSG method solved the problem graphically without the need of using partial derivatives as shown in the MIT website:
http://web.mit.edu/wwmath/vectorc/minmax/critical.html
1. Type the function:
2. Choose the proper ranges. In this example the range for x axis is [-3,3] and for y-axis is also [-3,3]:
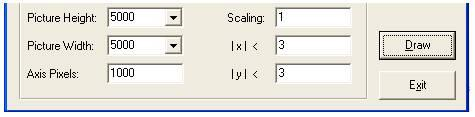
3. The size of the graph and the resolution can vary. In this example the picture height and width choose to be 5000, and the resolution is very fine (1000).
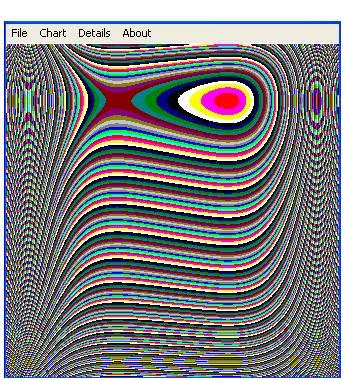
4. Click on Draw to have the answer:
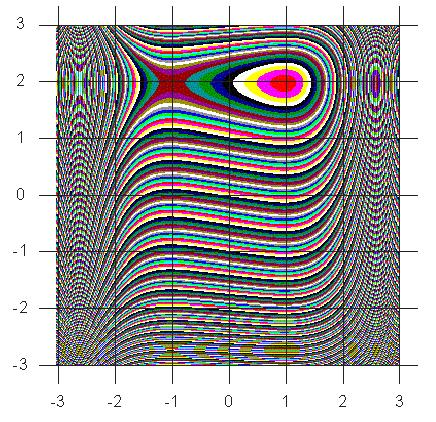
5. By drawing a grid we can find the position of the two critical points.
The minimum point of the function is (1,2).
And the point (-1,2) is a saddle point.
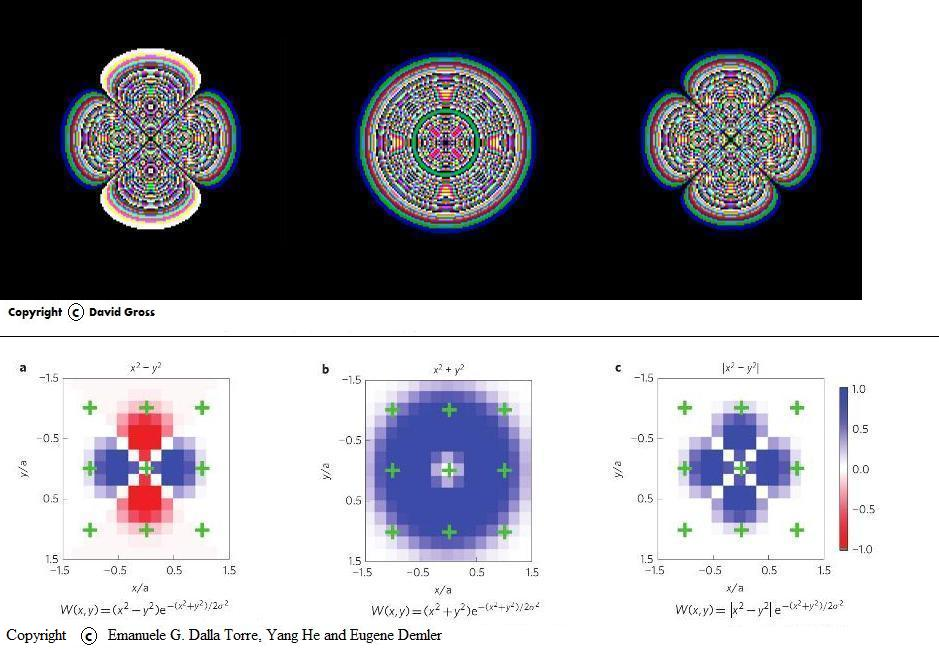
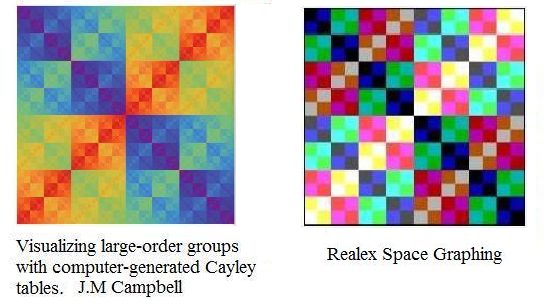
4. Wannier Functions
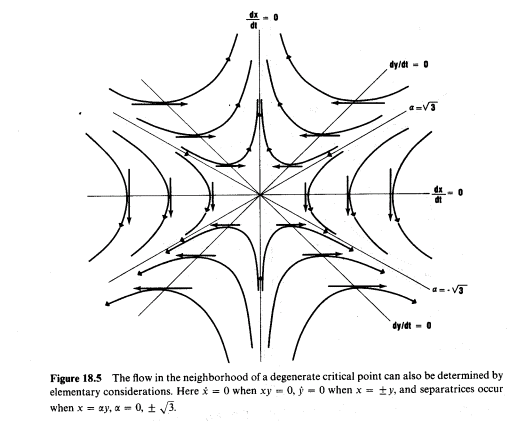
5. Cayley tables
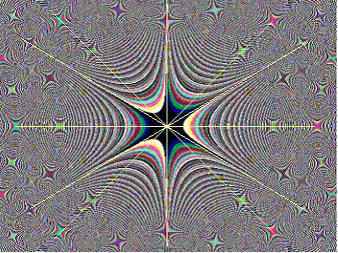
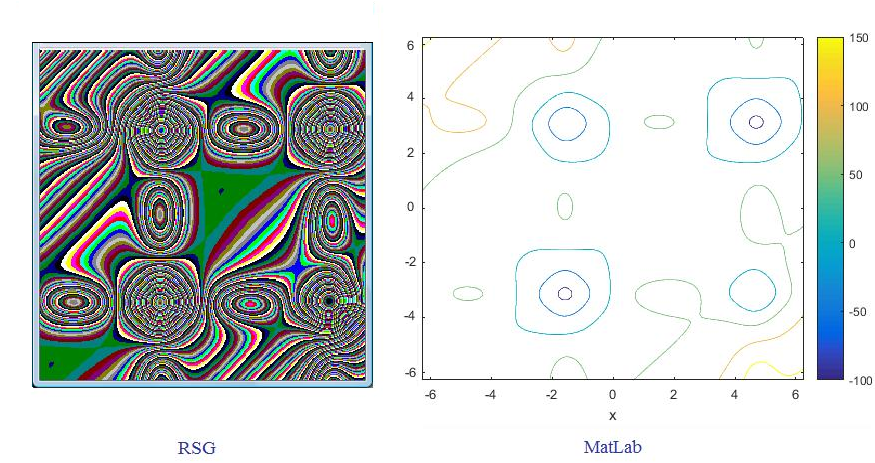
6. Catastrophe Theory
Comparison between the phase portrait result as shown in the book ‘Catastrophe Theory for Scientists and Engineers’ by Robert Gilmore:
and the result made by the RSG software:
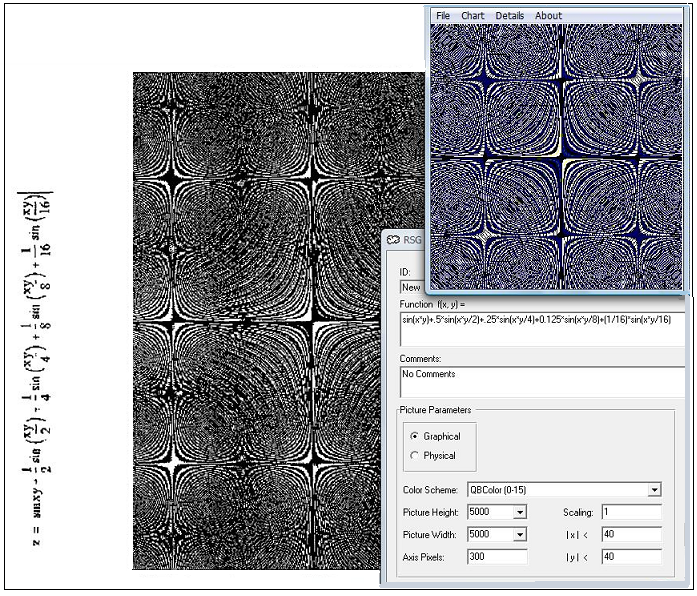
7. Fourier Transform
8. Phase Portrait
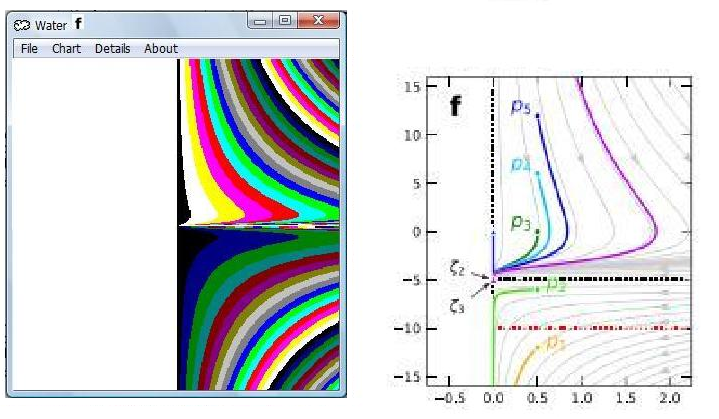
https://www.researchgate.net/publication/326998589_Appropriate_Boundary_Condition_for_Dupuit-Boussinesq_Theory_on_the_Steady_Groundwater_Flow_in_an_Unconfined_Sloping_Aquifer_With_Uniform_Recharge
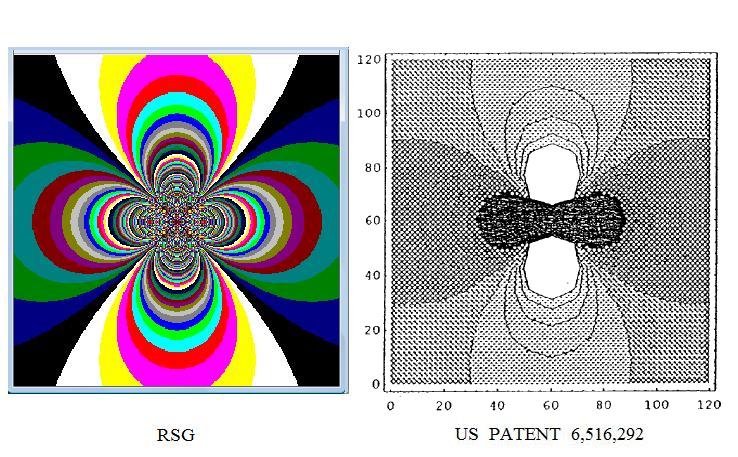
9. Optimization
http://benchmarkfcns.xyz/benchmarkfcns/birdfcn.html
10. Fluid Flow
https://patents.google.com/patent/US6516292B2/en?oq=us6516292